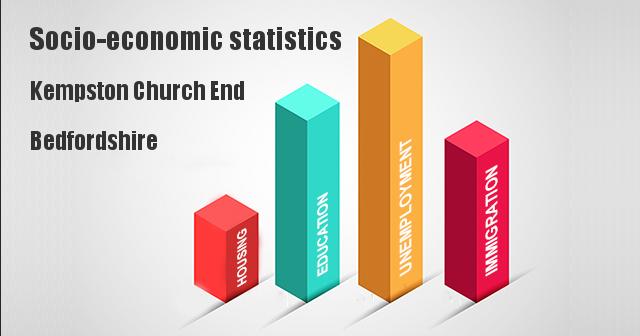
Is Kempston Church End rough? We have collated a series of socio-economic statistics and demographics from UK government sources such as the 2021 Census and the Index of Multiple Deprivation. They should give you a broad snapshot of the area and the surrounding locations. Are the residents of Kempston Church End older than the national average or younger? What is the population of Kempston Church End and Bedford? What is the claimant count in Kempston Church End and how many residents are unemployed? This page should provide you with the answers. We have analysed the Census 2021 raw data on country of birth and compiled immigration statistics as percentages of the population. All percentages have been rounded to two decimal places. Below are the figures for Kempston Church End in the Bedford local area district.
Kempston Church End has a higher level of home ownership than than the national average.What are the occupations of the residents of Kempston Church End?
The largest employment sector in Kempston Church End is Professional Occupations. The smallest employment sector is Process Plant & Machine Operatives.Sector Proportion Professional Occupations 25.15% Associate Professional & Technical 17% Managers, Directors & Senior Officials 16.86% Administrative & Secretarial 8.9% Skilled Trades 8.16% Caring, leisure & Other Services 7.35% Elementary Occupations 6.42% Process Plant & Machine Operatives 4% Kempston Church End Unemployment Statistics
Since the introduction of Universal Credit, The Department for Work & Pensions have not issued any statistics (in our view) that can be used to ascertain the levels of unemployment or under employment in the UK, just meaningless geographic counts. However, the Office of National Statistics does publish claimant counts of people receiving out of work benefits, be that legacy Jobseeker’s Allowance or Universal Credit as a proportion of people over 16. These figures are usually updated once a month and are for Local Authority Districts and Unitary Authority Districts. So below are the figures of Bedford.Area Unemployed Yearly Change Bedford 3.9% -0.3% East of England 3% -0.3% England 3.8% -0.3% UK 3.7% -0.3% Economic Status Proportion In Employment 70.05% In Part-Time Work 21.64% Unemployed 3.11% Kempston Church End Health Statistics
Kempston Rural has significantly more residents (>5%) describing their health as very good than the national average for England.Area VG G F B VB Kempston Rural 55.89% 33.08% 8.42% 2.23% 0.39% Bedford 48.82% 34.97% 11.85% 3.43% 0.94% East 48.28% 34.64% 12.5% 3.58% 1% England 48.49% 33.71% 12.65% 3.98% 1.17% How has the health of residents in Bedford changed since 2011?
Bedford residents who describe their health as either good or very good has increased by 0.91% between the 2011 and 2021 census.Year VG G F B VB 2011 46.9% 35.98% 12.58% 3.55% 0.98% 2021 48.82% 34.97% 11.85% 3.43% 0.94% Kempston Church End & Bedford Immigration Statistics
Area Born in UK Born outside UK Kempston Rural 83.85% 16.15% Bedford 78.6% 21.4% East 85.09% 14.91% England 82.65% 17.35% Kempston Church End compared to other wards in Bedford
';Kempston Church End is ranked 15 out of 27 wards in Bedford for the number of residents born outside of the UK.# Ward Born in UK Born outside UK 1 Cauldwell 56.9% 43.1% 2 Queens Park 57.1% 42.9% 3 Castle 62.03% 37.97% 4 Kingsbrook 68.23% 31.77% 5 Harpur 68.41% 31.59% 6 Kempston Central and East 72.88% 27.12% 7 Kempston South 76.05% 23.95% 8 De Parys 77.62% 22.38% 9 Goldington 78.9% 21.1% 10 Kempston North 79.59% 20.41% 11 Kempston West 80.38% 19.62% 12 Eastcotts 80.83% 19.17% 13 Newnham 81.68% 18.32% 14 Brickhill 83.08% 16.92% 15 Kempston Rural 83.85% 16.15% 16 Putnoe 84.1% 15.9% 17 Elstow and Stewartby 85.07% 14.93% 18 Bromham and Biddenham 87.54% 12.46% 19 Wilshamstead 88.31% 11.69% 20 Clapham 88.45% 11.55% 21 Great Barford 89.57% 10.43% 22 Wootton 89.88% 10.12% 23 Sharnbrook 91.94% 8.06% 24 Oakley 92.57% 7.43% 25 Harrold 93% 7% 26 Wyboston 93.76% 6.24% 27 Riseley 94.51% 5.49% Kempston Church End Age Distribution Statistics
We have taken the raw data from the 2021 Census and the calculated the proportion of age groups in Kempston Rural.Age Band Proportion 4 & under 
5 - 9 years 10 - 15 years 16 - 19 years 20 - 24 years 25 - 34 years 35 - 49 years 50 - 64 years 65 - 74 years 75 - 84 years 85 years & over How many residents own or rent their home in Kempston Church End and Bedford
We have taken the raw data from the 2021 census and calculated what proportion of people in Kempston Church End either own or rent their home. All percentages have been rounded to two decimal places. 70.87 of residents own their home either outright or mortgaged. 29.13 of Kempston Church End residents rent their home either privately or through a social landlord.Area Owned Rented Kempston Rural 70.87% 29.13% Bedford 62.66% 37.34% East 65.23% 34.77% England 61.31% 38.69% Kempston Church End compared to other wards in Bedford
Kempston Church End is ranked 14 out of 27 wards in Bedford for the percentage of home owners.# Ward Owned Rented 1 Bromham and Biddenham 83.76% 16.25% 2 Oakley (Bedford) 81.55% 18.45% 3 Putnoe 81.45% 18.55% 4 Wyboston 78.87% 21.13% 5 Sharnbrook 78.19% 21.81% 6 Kempston South 77.81% 22.19% 7 Riseley 76.73% 23.27% 8 Great Barford 76.08% 23.92% 9 Wilshamstead 75.15% 24.85% 10 Clapham 75.13% 24.87% 11 Brickhill 74.94% 25.06% 12 Wootton (Bedford) 74.42% 25.58% 13 Harrold 71.62% 28.38% 14 Kempston Rural 70.87% 29.13% 15 Newnham (Bedford) 70.4% 29.6% 16 Elstow and Stewartby 67.67% 32.33% 17 Eastcotts 66.99% 33.01% 18 Kempston Central and East 61.24% 38.76% 19 Kempston West 59.25% 40.75% 20 De Parys 57.9% 42.1% 21 Kempston North 55.11% 44.89% 22 Goldington 51.56% 48.44% 23 Queens Park (Bedford) 50.95% 49.05% 24 Kingsbrook 46.77% 53.23% 25 Cauldwell 41.95% 58.05% 26 Harpur 38.31% 61.69% 27 Castle (Bedford) 29.51% 70.49% Kempston Church End Education Statistics
We have taken the raw data from the 2021 census to found of the level of education Kempston Church End residents have in terms of formal qualifications as a percentage. The UK government breaks qualifications down into 7 levels. A detailed explanation of these levels can be found here. However, the Census groups these into just 4 \'levels\'. Here are some examples of the qualifications each census level represents when not stated;
| Level | Kempston Rural | England |
|---|---|---|
| No Qualifications | 9.32% | 18.08% |
| Level 1 | 8.17% | 9.69% |
| Level 2 | 13.46% | 13.32% |
| Apprenticeship | 4.14% | 5.32% |
| Level 3 | 18.19% | 16.92% |
| Level 4 | 44.63% | 33.92% |
What is the population of Kempston Church End and Bedford?
The table below contains the populations figures for each ward in Bedford including Kempston Church End. These population ONS figures are estimated are dated Mid 2020.
| Ward | Population |
|---|---|
| Brickhill | 7969 |
| Bromham and Biddenham | 6963 |
| Castle | 8526 |
| Cauldwell | 11189 |
| Clapham | 4555 |
| De Parys | 6817 |
| Eastcotts | 4663 |
| Elstow and Stewartby | 4885 |
| Goldington | 9687 |
| Great Barford | 8283 |
| Harpur | 8718 |
| Harrold | 4158 |
| Kempston Central and East | 6981 |
| Kempston North | 3609 |
| Kempston Rural | 6763 |
| Kempston South | 3900 |
| Kempston West | 6485 |
| Kingsbrook | 9764 |
| Newnham | 7769 |
| Oakley | 3709 |
| Putnoe | 6923 |
| Queens Park | 9502 |
| Riseley | 3358 |
| Sharnbrook | 3809 |
| Wilshamstead | 5842 |
| Wootton | 6270 |
| Wyboston | 3590 |
| Bedford Total | 174687 |
Last updated: 20/02/2024, Additional Sources: Office for National Statistics & Department for Work & Pensions.

Kickstart your 2025 side hustle
Click the link https://temu.to/m/etcqkjpivoy or search “ini98453” in the app to join ⭐️Temu Affiliate Program⭐️! Up to 💰£100,000 per month is waiting for you~!